Creating Dashboards in R using shiny and flexdashboard
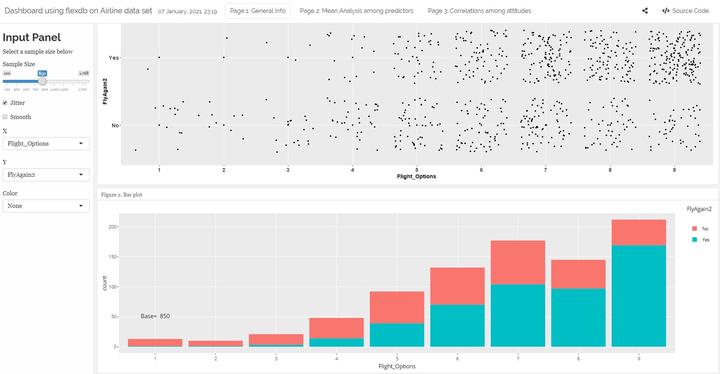
In this dashboard created in R using Shiny that can be viewd live from here. The link might take a while to load as it is run on a free R studio server. The dashboard contains a set of exploratory analysis and interactive charts on the airline data set.
Faraz Ahmadi
Data Scientist, M.Sc Candidate
Intersted in data-driven decision making. Using data to find insight and knowledge.